
Best DevOps Monitoring Tools
DevOps monitoring tools can help software developers and project managers of software development teams gain critical insight into potential problems and system performance to ensure everything runs smoothly and efficiently. As DevOps has grown in popularity, the number of DevOps tools entering the market has exploded. This guide will help you filter through all of the available options by focusing on the top DevOps monitoring software. Specifically, we will discuss the following in terms of features, pricing, pros and cons:
- AppDynamics: A great option for developers seeking a flexible and customizable DevOps monitoring tool with solid analytics to optimize their application performance and business operations.
- Sensu: A solid pick for organizations needing scalable monitoring capabilities for complex infrastructure, all from a tool with tons of community plugins and third-party integrations.
- Dynatrace: Ideal for development teams seeking a comprehensive monitoring tool with AI-driven insights and hourly pricing.
Jump to:
AppDynamics
AppDynamics is an all-in-one application-performance monitoring tool that offers flexibility, customization and powerful analytics for organizations looking to optimize user experiences and digital business outcomes.
Features of AppDynamics
Some of AppDynamics’ top features as a DevOps monitoring tool include:
- Multi-platform support.
- Real-time application-issue spotting.
- Custom dashboards.
- Business IQ.
- User Experience.
- Infrastructure.
- Security.
AppDynamics’ flexibility as a DevOps tool begins with monitoring support for various platforms, including AWS, Microsoft Azure, Kubernetes and more. IT teams can quickly pinpoint what is affecting business metrics as AppDynamics uses machine learning to offer real-time root-cause diagnoses of what is behind application problems (code-level issues, third-party APIs, etc.). DevOps teams can enjoy real-time monitoring and troubleshooting to fix issues on the spot.
Project managers are able to enjoy the ability to create custom dashboards to see select data without having to write code. There is also a Business IQ feature that focuses on only the most relevant insights and metrics to fix and expand for optimization, as well as a User Experience feature with journey maps and more to ensure customer satisfaction.
AppDynamics lets developers visualize infrastructure components for optimization (server, database, hybrid, cloud-native environments, etc.) and can detect vulnerabilities in security and application code within minutes.
Pros of AppDynamics
AppDynamics’ pros include:
- Simple setup.
- Customization.
- Real-time visibility.
- Graphs and charts.
AppDynamics is easy to install and configure. The customizable dashboard is another plus, putting users in charge of what insights they see.
The DevOps tool offers real-time insights into application performances, letting users quickly pinpoint and fix problems before they negatively impact end users. The graphs and charts are also valuable tools, offering even non-technical users insight into what is happening.
Cons of AppDynamics
AppDynamics’ cons include:
- No free plan.
- High costs.
- Excessive features for some.
- Resource usage.
Unlike some competing developer tools, AppDynamics does not have a free plan. Combine that with a cost that may seem high, and smaller teams with limited budgets may find AppDynamics out of their price range.
While AppDynamics may seem costly, it does offer a multitude of monitoring features. That may seem like a pro to some, but to others, including smaller teams with needs for less varied functionality, all of AppDynamics’ offerings may seem like overkill. And lastly, AppDynamics can negatively impact smaller systems because it uses significant memory and CPU.
Pricing of AppDynamics
AppDynamics offers a free 15-day trial, plus the following pricing plans:
- Infrastructure Monitoring Edition: $6 per month per CPU core.
- Premium Edition: $60 per month per CPU core.
- Enterprise Edition: $90 per month per CPU core.
- Enterprise Edition for SAP Solutions: $167 per month per CPU core.
- Real User Monitoring: $0.06 per month per 1,000 tokens.
The Infrastructure Monitoring Edition offers foundational infrastructure diagnostics, including servers, containers and networks. The Premium Edition offers complete backend monitoring. This includes infrastructure, application performance and database monitoring. The Enterprise Edition monitors backend and business performance. It includes everything from Premium, plus business performance monitoring. The Enterprise Edition for SAP Solutions offers infrastructure, business performance and SAP monitoring. And the Real User Monitoring plan offers business performance and end-user monitoring. All plans include unlimited access to AppDynamics University and its library of e-learning materials on configuring, managing and observing the full stack.
SEE: Top DevOps Collaboration Tools for Developers
Sensu
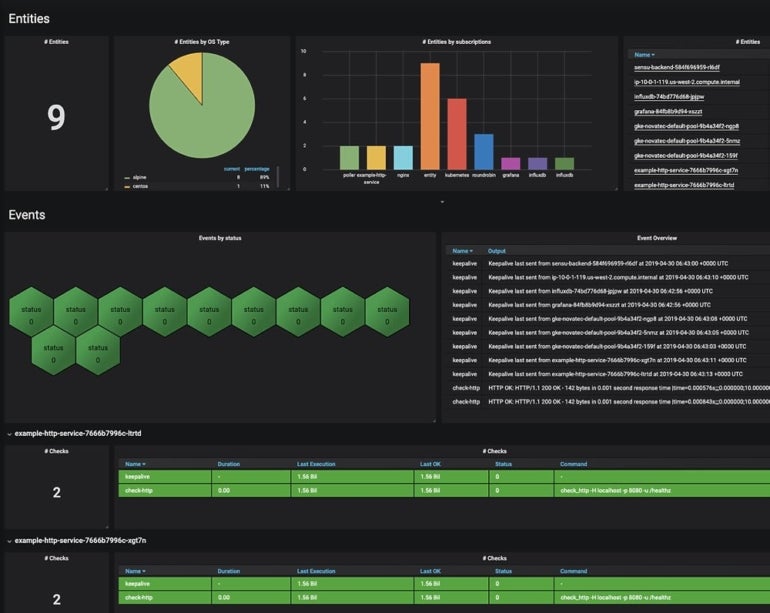
Sensu is a cloud-based DevOps tool that monitors infrastructure, applications and more. Its numerous community plugins and third-party integrations make it ideal for teams seeking an extensible and scalable monitoring tool.
Features of Sensu
Sensu’s highlighted features include:
- Pre-configured templates.
- Auto-remediation.
- Custom alerts.
- Incident management.
- Custom metrics.
- Plugins and integrations.
Sensu has several pre-configured templates that offer the versatility of monitoring-as-code workflows without the need for code. The monitoring tool has auto-remediation that self-heals by triggering service restarts or executing custom scripts when issues are spotted.
You can get alerts via SMS, email, Slack, etc. via customized policies and event filters, create and fix incidents in Jira, ServiceNow and PagerDuty, collect basic and custom metrics and more. Sensu also has over 200 community plugins and integrations with third-party platforms and tools like Google Cloud, AWS, Docker, Splunk, Puppet, Chef, Ansible, Slack, Opsgenie, Nagios, Prometheus and more.
Pros of Sensu
Sensu has several strengths as a monitoring DevOps tool, including:
- Customizability and flexibility.
- Easy configuration.
- Tons of community plugins.
- Integrations.
Sensu is a very customizable and versatile monitoring tool that is easy to configure. The 200-plus community plugins are great, as are the integrations with popular third-party developer tools such as Slack, Opsgenie, Chef, Puppet, Ansible and more.
Cons of Sensu
Areas where Sensu could improve as a programmer tool include:
- User interface.
- Documentation.
- Price.
Sensu’s user interface could use some work: some users have even gone so far as to call it “primitive.” Documentation is another gripe against Sensu, noted by users that it should be easier to understand for those new to the DevOps monitoring tool. And while Sensu does have a free offering, its price, especially after some increases, may be high for smaller teams with minimal budgets.
Pricing of Sensu
Sensu has three pricing plans to choose from, plus a 14-day free trial:
- Sensu Go Free: No cost for new Sensu users, individuals and very small software development teams.
- Sensu Go Pro: $3 per month per node, paid annually. The most popular plan, ideal for small-to-midsized businesses.
- Sensu Go Enterprise: $5 per month per node, paid annually. Created for large teams.
The Free plan works for one site and up to 100 nodes. It offers commercial features for those first 100 nodes, which include server and container monitoring, real-time inventory, health checks, custom metrics, alerts, incident management, automated remediation, custom workflows, over 200 community plugins, dashboards, built-in configuration and user management, and integrations.
The Pro plan works for one site and 100-3,000 nodes. It includes commercial features, commercial support and a six-hour response time. The Enterprise plan works for unlimited sites and 300-unlimited nodes. It offers commercial features and support, plus a three-hour response time.
SEE: What is the DevOps Lifecycle?
Dynatrace
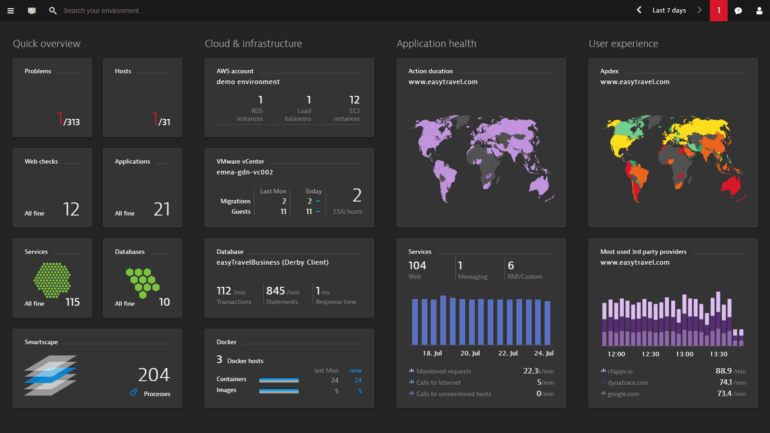
Dynatrace is a full-stack monitoring tool that is powered by AI. Developers can use Dynatrace to gain real-time insights into application performance, user experience and infrastructure.
Features of Dynatrace
Some of Dynatrace’s top features include:
- Full-stack monitoring.
- Infrastructure monitoring.
- Real user monitoring.
- Synthetic monitoring.
- Application security.
- Automation.
- Davis AI.
Dynatrace can monitor multiple facets of an organization to offer complete visibility into performance, including infrastructure, servers, networks, clouds, real users and applications.
It is highly versatile and can offer benefits to various teams. For instance, businesses can use Dynatrace to optimize their user experience and increase conversions. Development teams can use the tool to deliver higher-quality software at a faster rate. Security specialists can use Dynatrace to keep services resilient and reliable while drastically decreasing time spent on vulnerabilities. And operations teams can operate more efficiently to reduce support tickets.
Beyond offering observability into infrastructure, real users, applications and security, Dynatrace also offers business analytics and Davis, an AI engine that helps automate operations by constantly looking for issues and their root causes, and offering solutions for self-healing.
Pros of Dynatrace
The main advantages of Dynatrace include:
- All-in-one functionality.
- Solid alerting system.
- AI-driven analytics.
- Support.
Dynatrace covers monitoring from all angles, giving project managers and developers 360-degree insights into performance and health. The alerting system offers instant insight into issues, and the AI-driven analytics are in a class of their own. The ability to create custom reports is also a major plus. And Dynatrace offers solid support when needed.
Cons of Dynatrace
The main disadvantages of Dynatrace include:
- Learning curve.
- User interface.
- Documentation.
- Cost.
Although Dynatrace is a top-notch monitoring tool, it takes time to get used to its advanced features. The user interface could be more intuitive and allow for easier navigation, and better documentation would help ease adoption. Dynatrace’s cost can also creep up, making it tougher for those with limited budgets to access.
Pricing of Dynatrace
Dynatrace takes a simple approach to pricing. The developer tool claims to offer the only hourly pricing in the industry, allowing software development teams to only pay for what they need. There is a 15-day free trial, and pricing is divided according to category. Here are some examples:
Host monitoring:
- Full-stack monitoring: $0.01 per memory-GiB-hour.
- Infrastructure monitoring: $0.04 per hour for any size host.
Digital experience monitoring:
- Real User Monitoring: $0.00225 per session.
- Real User Monitoring with Session Replay: $0.009 per session replay capture.
- Real User Monitoring Property: $0.0001 per property per session.
- Browser Monitor or Clickpath: $0.009 per synthetic action.
- Third-Party Synthetic API Ingestion: $0.001 per third-party synthetic result.
- HTTP Monitor: $0.001 per synthetic request.
Dynatrace also has separate pricing for Log Management and Analytics, Events powered by Grail, Automation and Platform Extensions. You can view all of Dynatrace’s pricing details here.
What to look for in DevOps monitoring software
While the ideal DevOps monitoring tool will differ according to the needs of your specific software development team, there are a few essential characteristics you should look for to simplify your search.
For starters, the DevOps monitoring software should be user-friendly (even for non-technical users) and easy to set up, configure and maintain. It should have an intuitive interface, solid supporting documentation, customer support and, if possible, a large following or community to provide additional resources. Next, look for comprehensive monitoring features. Some of the standard offerings include real-time monitoring, performance metrics, log analysis, error tracking, alerts, reporting, dashboards, etc.
Your DevOps monitoring software should have extensible functionality via third-party integrations and security via features like encryption and role-based access control. It should also be scalable and flexible to fit your needs. And lastly, the DevOps monitoring software you pick should have pricing that fits your budget.
Final thoughts on the best DevOps monitoring tools
The DevOps monitoring tools in this guide are some of the best due to their comprehensive features and usability. Before picking a developer tool, make sure its features, user-friendliness and pricing align with your needs so it helps — instead of hinders — your team.
Source: News
