
Microsoft Power BI Review (2023): Features, Pros & Cons
Microsoft Power BI’s fast factsPricing: Paid plans start at $10 per user per month. Key Features:
Free Trial: 30 days |
Power BI is a market leader in the data visualization and business intelligence arena. With its cloud-based and on-premises capabilities, Power BI offers a versatile platform that caters to a variety of data analytics needs. Its thorough feature set, ranging from real-time dashboards to complex data modeling, makes it a popular choice for organizations that need an expansive solution for their data analytics requirements.
This Microsoft Power BI review shows what the tool has to offer across its pricing, features and use cases and provides alternatives should you determine Power BI not to be right for your business.
Jump to:
Microsoft Power BI pricing
Microsoft Power BI offers multiple pricing options to deliver analytics to users and organizations of all sizes. It has 5 main plans, including a free plan.
For businesses wanting to try Power BI before making a purchasing decision, they can try its 30-day free trial.
Power BI in Microsoft Fabric free account
Power BI offers a complimentary tier that allows users to generate detailed, interactive reports. This free tier is integrated into Microsoft Fabric and doesn’t need a credit card for activation. However, sharing reports requires an upgrade to either Power BI Pro or Power BI Premium.
Power BI Pro
Designed for individual users, this tier focuses on modern, self-service analytics that facilitates the publishing of reports and dashboards. While it’s included in the Microsoft 365 E5 package, for businesses that want to invest only in Microsoft Power BI, it costs $10 per user per month. For publishing and sharing reports, this Power BI Pro license is needed.
Power BI Premium
This version is made for users who need advanced features like larger model sizes, more frequent data refreshes and XMLA read/write capabilities. Priced at $20 per user per month, it encompasses all the functionalities of Power BI Pro.
Power BI Premium Per Capacity
This organizational tier starts at $262.80 per capacity per month for the Fabric SKUs tier and from $4,995 per capacity per month for the Power BI Premium SKUs. It enables multiple users to interact with reports without the need for additional per-user licenses. All features available in the Power BI Premium per user are included in this tier.
Key features of Microsoft Power BI
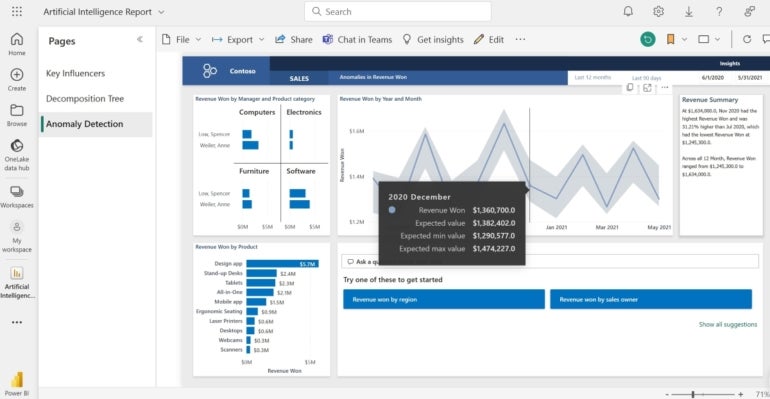
Real-time dashboards
Power BI’s real-time dashboards offer a live, 360-degree view of business data (Figure A). Unlike other BI tools that may require a manual refresh, Power BI’s dashboards update in real time, allowing for immediate decision-making. Users can interact with elements in their dashboard in real-time which speeds up how they interact with data and make decisions.
Figure A
Any industry that finds real-time data to be crucial to its operations, such as e-commerce and finance, will cherish this feature.
SEE: For more on Power BI dashboards, learn how to create a dashboard in Power BI.
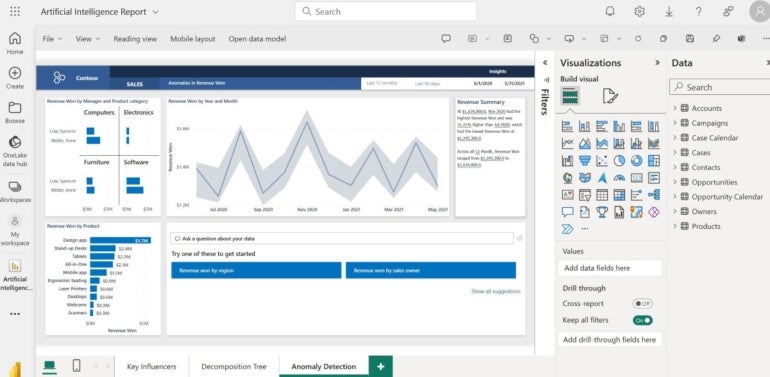
Data modeling
Power BI provides robust data modeling capabilities that enable users to transform raw data into meaningful insights (Figure B). This feature gives users the ability to tell compelling narratives using complex data. It offers a range of prebuilt models and the flexibility to create custom models, which will appeal to businesses that work with complex data structures.
Figure B
Custom visualizations
The platform allows for custom visualizations, enabling users to create reports and dashboards that are aligned with their business needs (Figure C). Users can set up visualizations across at least 36 visuals, with the option to search for more. Organizations that value specialized reporting formats will appreciate this feature, which is something not all competitors offer.
Figure C
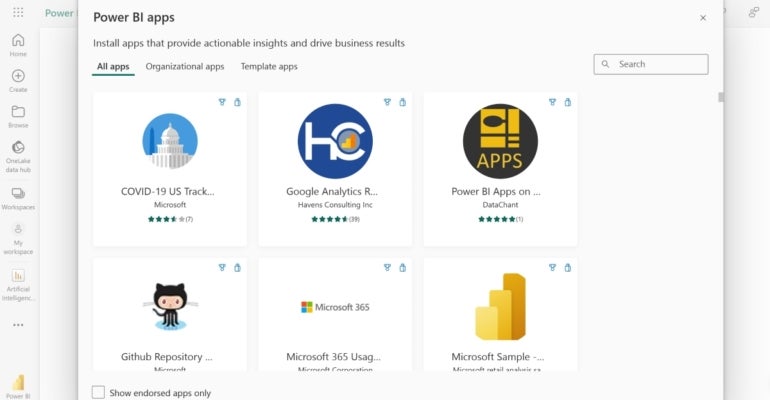
Integration with Microsoft products
One of Power BI’s standout features is its seamless integration with other Microsoft products like Excel, Azure and Dynamics 365. This integration simplifies data import and export, which honestly makes it an easy choice for businesses already invested in the Microsoft ecosystem. Power BI also has a wide roster of applications to help users get actionable insights (Figure D).
Figure D
An example of an integration that makes teams quite collaborative is the option to share reports to Microsoft Teams, converse with other team members concerning it and ultimately make decisions.
SEE: To understand similar integrations, be sure to check out our guide on how to use Power BI in Outlook and Office for data storytelling.
Mobile accessibility
Power BI offers a mobile application that allows users to access their dashboards and reports on the go (Figure E). The mobile app is user-friendly and retains most functionalities of the desktop version, making it a good fit for remote teams and field workers.
Figure E
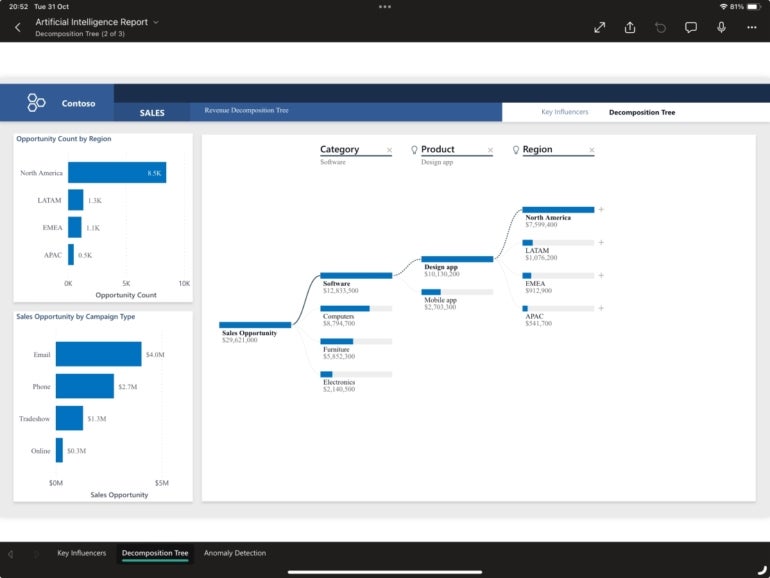
Its user interface on iPadOS in particular is sleek and modern, paired with some flexible features like the Split VIew, which allows users to split their screens to view data from other applications and Power BI simultaneously.
Users can customize visuals for the Power BI mobile app from their desktop to ensure visualizations are correctly displayed even on mobile platforms.
Microsoft Power BI customer service
Power BI has a live chat feature that enables users to interact with the Microsoft Sales bot, which gets a feel of what they need by asking questions and then providing options on how to help for their issue.
A couple of options it presents include, “forum support,” which directs users to Microsoft forums, and “contact support,” which leads to a support page. The support page offers a variety of solutions, including guidance on creating support requests and learning resources.
Microsoft Power BI ease of use
On both desktop and mobile, Power BI is easy to use, with an interface that’s quite powerful yet never feels overwhelming, regardless of the complexity of the data in use. Power BI clients can toggle the display of their BI home screens between expanded and simplified views, to choose the page layout that suits them. However, this feature seems only to be available on desktop.
It also has a drag-and-drop feature for creating visualizations and the straightforward process for importing data contributes to its overall ease of use. Moreover, Power BI offers a range of tutorials and guides to help users get acquainted with the platform, making it accessible for both beginners and experienced users.
Microsoft Power BI pros and cons
| Pros | Cons |
|---|---|
|
|
Who is Microsoft Power BI best for?
While its features and scalability make it a tool that everyone — whether individuals, small and midsize businesses, or large enterprises — can easily use, Power BI best serves:
- Midsize to large businesses: With features like custom visualizations and robust data modeling, Power BI is an excellent fit for midsize businesses and large enterprises that have more complex data analytics needs.
- Microsoft users: Businesses already invested in Microsoft’s ecosystem will find Power BI’s seamless integration with Microsoft products like Excel, Azure and Teams to be a significant plus.
- Data-driven organizations: Companies that heavily rely on real-time data for decision-making can make the most out of Power BI’s real-time dashboards and extensive data modeling capabilities.
Microsoft Power BI alternatives
Even though Power BI is a comprehensive and highly intuitive tool, it’s impossible for it to appeal to every kind of user, especially considering factors such as pricing, use cases and learning curves among others. For one reason or another, should Microsoft Power BI not prove ideal for you, here are a few Power BI alternatives.
| Features | Power BI | Looker | Tableau | QlikView |
|---|---|---|---|---|
| Real-Time Dashboards | Yes | Yes | Yes | Yes |
| Data modeling | High | Medium | High | Medium |
| Custom visualizations | Yes | Yes | Yes | Limited |
| Mobile accessibility | Yes | Yes | Yes | Yes |
| Free Trial | 30 days | 14 days | 14 days | Length unspecified |
| Starting price per user per month | $10 | $30 | $15 | $20 |
Looker
Looker is a modern data platform with a unique data modeling layer that allows users to define business metrics centrally. Unlike Power BI, it’s not known for native Microsoft integration but excels in data governance and centralized metric definitions. This makes Looker a strong alternative, especially in the area of data governance.
SEE: For more information, check out our Looker Studio cheat sheet.
Tableau
Tableau is known for its advanced data visualization capabilities and a community-driven data visualization library, which are features that Power BI also offers but not as extensively. But what sets Tableau apart is its natural language query feature, allowing users to type questions and get visual responses. Businesses that require advanced visual analytics may be enticed by the allure of Tableau.
SEE: For more information, explore our Tableau data analytics cheat sheet.
QlikView
QlikView is a business intelligence tool that offers associative data modeling, which allows for complex data discovery and preparation. Unlike Power BI, it doesn’t offer extensive custom visualizations. However, its associative data model allows for more complex queries, making its case for businesses that need intricate data preparation and discovery.
These three tools prove to be competent alternatives should Microsoft Power BI not be a match for you. To learn more about Looker and Tableau, see how they compare in our Looker vs Tableau article.
SEE: Discover how QlikView compares to Tableau.
How we evaluated Microsoft Power BI
To provide this Microsoft Power BI review, we researched its features, pricing, pros and cons to get an understanding of what the software is good at and what it struggles with. This was informed by Power BI’s website and reviews from verified users to gauge how Power BI delivers the features it lists. We then tried the software for ourselves to get a hands-on feel and compare our experience with the experiences of other users. The hands-on experience also helped us understand who the tools would be best for and what kind of user would prefer an alternative.
To go beyond the surface level with this tool and learn how to use Power BI, read our Microsoft Power BI cheat sheet.
Source: News